The Million-Dollar Question That Changes Everything
Have you ever wondered why some forex traders seem to have a magic touch while others lose their shirts? The SECRET isn’t luck, timing, or even having more money to start with. It’s knowing which advanced indicators to use & when to use them. Most beginners stick to simple moving averages & basic RSI, but the REAL money is made when you understand the sophisticated tools that professional traders guard like precious secrets.
Think about it this way – if everyone is using the same basic indicators, how can you get an edge? It’s like trying to win a race while everyone else has better equipment. The forex market moves over $6 trillion every single day, & most of that money flows toward traders who use advanced analytical tools that go beyond the obvious. These aren’t your grandmother’s trading indicators we’re talking about.
In this comprehensive guide, we’ll dive deep into the most POWERFUL advanced forex indicators that can transform your trading results from mediocre to magnificent. We’ll explore everything from Ichimoku clouds that predict future price movements to Volume Profile analysis that shows you where the big money is hiding. By the end of this article, you’ll have a complete toolkit of professional-grade indicators that can help you spot opportunities others miss & avoid traps that catch amateur traders every single day.
The Ichimoku Cloud: Your Crystal Ball for Future Price Action
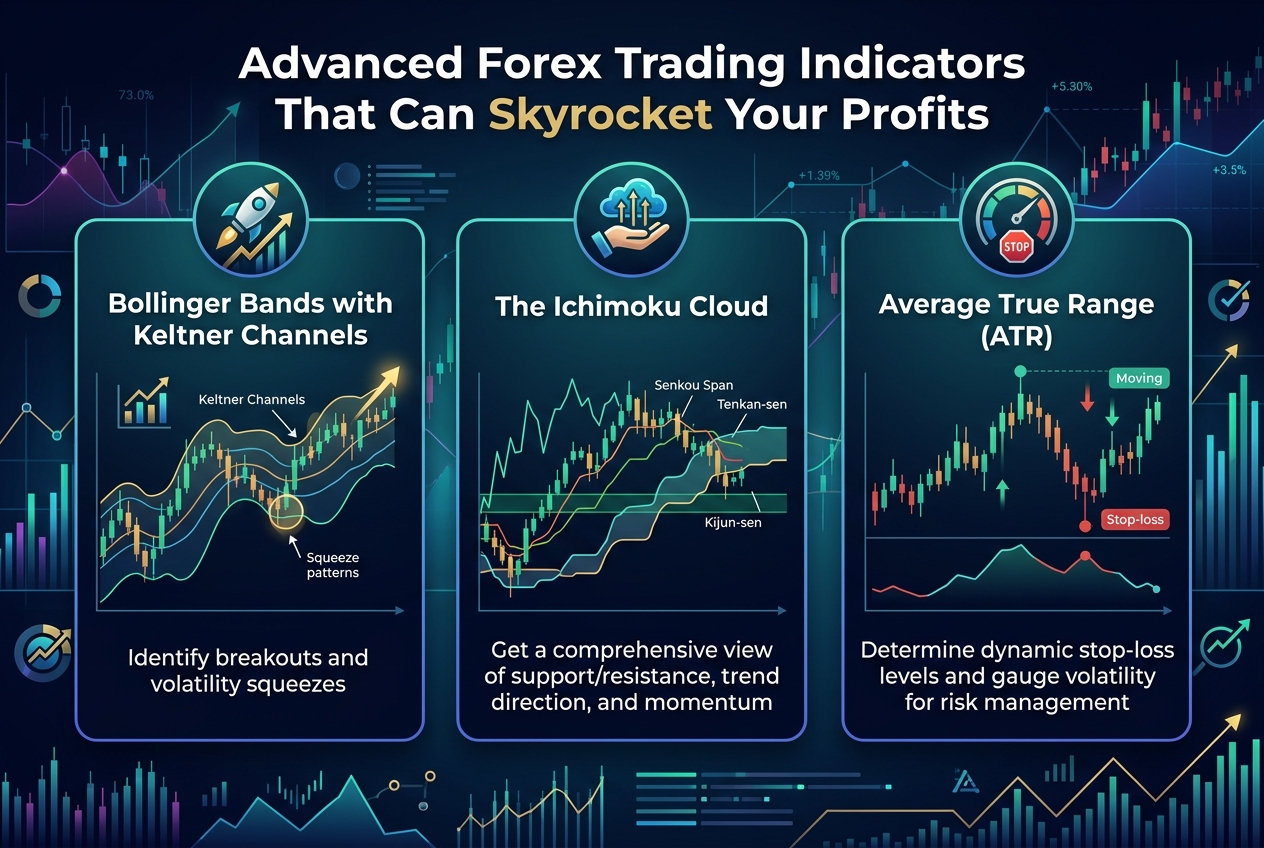
The Ichimoku Kinko Hyo, or simply “Ichimoku Cloud,” is like having a time machine for your trading. This Japanese indicator doesn’t just tell you what’s happening now – it shows you what’s LIKELY to happen in the future. Most traders get scared when they first see an Ichimoku chart because it looks complicated with all those lines & colored areas. But once you understand how it works, you’ll wonder how you ever traded without it.
The cloud itself acts like a POWERFUL support & resistance zone that moves into the future. When price is above the cloud, you’re in bullish territory. When it’s below, bears are in control. But here’s where it gets really interesting – the cloud shows you these levels ahead of time! The Tenkan-sen & Kijun-sen lines work together to give you entry & exit signals that are way more reliable than simple moving average crossovers.
What makes Ichimoku truly advanced is how it combines multiple timeframes in one view. The Chikou Span (lagging line) confirms your trades by showing you if current price action aligns with historical patterns. Professional traders use Ichimoku to identify the overall trend, find precise entry points, & set realistic profit targets all at once. For example, when the Tenkan-sen crosses above the Kijun-sen while price breaks above the cloud, you’ve got a triple confirmation that a strong uptrend is beginning.
The BEAUTY of Ichimoku is that it works on any timeframe, from scalping on 5-minute charts to position trading on daily charts. Many successful traders use it as their primary indicator because it gives them everything they need in one comprehensive system. Once you master reading the cloud’s thickness, color changes, & the relationship between all five lines, you’ll start seeing market movements before they happen.
Volume Profile: Where the Big Money Really Lives
While most traders focus only on price action, smart traders know that VOLUME tells the real story. Volume Profile is an advanced indicator that shows you exactly where the most trading activity happened at specific price levels. Think of it as a heat map that reveals where institutional traders & big banks are accumulating or distributing their positions. This information is like having insider knowledge without breaking any rules.
The Volume Profile displays horizontal bars at different price levels, showing you the Point of Control (POC) – the price where the most volume traded. This level acts like a magnet for future price action. When price moves away from the POC, it often gets pulled back like a rubber band. High Volume Nodes (HVN) become strong support & resistance levels, while Low Volume Nodes (LVN) are areas where price tends to move quickly through.
What makes Volume Profile incredibly POWERFUL is how it reveals market psychology. When you see massive volume at a certain price level, it means many traders have positions there. They’ll fight to defend that level, creating strong support or resistance. Smart traders use this information to place their trades near these high-volume areas where they know the market will react.
Professional traders combine Volume Profile with other indicators to create incredibly accurate trading strategies. For instance, when price approaches a high-volume node while showing bullish divergence on RSI, you’ve got a high-probability long setup. The big institutions can’t hide their footprints from Volume Profile analysis, giving retail traders a chance to follow the smart money instead of fighting against it.
Fibonacci Retracements & Extensions: The Mathematical Magic of Markets
Mathematics runs deeper in forex markets than most people realize, & Fibonacci levels are proof that markets follow natural patterns. These aren’t just random lines on a chart – they represent psychological levels where traders make decisions based on centuries of market behavior. The AMAZING thing about Fibonacci levels is how accurately they predict where price will find support, resistance, & reversal points.
The most common Fibonacci retracement levels are 23.6%, 38.2%, 50%, 61.8%, & 78.6%. When a currency pair makes a strong move & then starts to retrace, it often finds support or resistance at these exact levels. The 61.8% level, known as the “Golden Ratio,” is particularly POWERFUL because it represents the mathematical relationship found throughout nature. Many professional traders base their entire strategies around this single level.
Fibonacci extensions take this concept further by showing you where price is likely to go after breaking out of a retracement. The 161.8% & 261.8% extension levels are like magnets for price action, giving you precise profit targets that often work with scary accuracy. When you combine Fibonacci levels with other advanced indicators, you create a trading system that can predict market movements with mathematical precision.
The SECRET to using Fibonacci effectively is knowing which swing highs & lows to connect. Amateur traders draw Fibonacci lines randomly, but professionals look for significant highs & lows that align with other technical factors. When multiple Fibonacci levels from different swings cluster around the same price area, you’ve found what traders call a “Fibonacci confluence zone” – one of the most reliable areas to place trades in the entire forex market.
MACD Histogram: The Hidden Momentum Detector
Everyone knows about MACD, but few traders understand the true POWER hidden in its histogram. While the basic MACD lines show you trend direction & crossovers, the histogram reveals momentum changes before they show up anywhere else. This makes it one of the most advanced & underutilized tools in forex trading. The histogram measures the distance between the MACD line & its signal line, giving you early warning signals that can make or break your trades.
When the histogram starts forming higher lows while price makes lower lows, you’re seeing bullish divergence – a strong signal that the downtrend is losing steam & a reversal might be coming. Conversely, when the histogram makes lower highs while price makes higher highs, bearish divergence warns you that the uptrend is weakening. These signals often appear several bars before the actual price reversal, giving you a significant advantage over other traders.
The GENIUS of histogram analysis lies in understanding its rhythm. Strong trends show expanding histogram bars in the direction of the trend. When these bars start shrinking, even while price continues in the same direction, momentum is fading & you should prepare for a change. Professional traders use histogram patterns to fine-tune their entries & exits, often catching reversals at the exact moment they begin.
Advanced MACD histogram strategies involve looking for specific patterns like “histogram hooks” & “momentum failures.” A histogram hook occurs when the histogram reverses direction for one or two bars before resuming the trend – often marking the end of a pullback & the resumption of the main trend. These subtle patterns separate professional traders from amateurs because they require patience & skill to identify correctly.
Bollinger Bands with Bandwidth: Volatility’s Best Friend
Bollinger Bands are common, but most traders don’t know about Bollinger Bandwidth – the indicator that measures how wide or narrow the bands are at any given time. This ADVANCED application turns a simple volatility tool into a powerful predictor of major market moves. When bandwidth reaches extremely low levels, it means volatility is compressed & a big move is coming soon. The question isn’t if price will explode – it’s which direction.
The “Bollinger Band Squeeze” happens when bandwidth drops to its lowest levels in months. During these periods, price action becomes boring & many traders lose interest. But smart traders know this is when the market is loading up like a coiled spring. When the squeeze finally releases, the resulting move can be massive & sustained, offering incredible profit opportunities for those who were patient enough to wait.
Professional traders combine Bollinger Bands with other indicators to determine which direction the breakout will go. When price is near the upper band & RSI shows overbought conditions, a downward breakout becomes more likely. Conversely, when price hugs the lower band while showing bullish divergence on MACD, an upward explosion could be imminent.
The BEAUTY of Bollinger Bandwidth is how it works across all timeframes & currency pairs. Whether you’re scalping EUR/USD on 15-minute charts or swing trading GBP/JPY on 4-hour charts, periods of low volatility always precede periods of high volatility. By monitoring bandwidth levels, you can position yourself before the big moves happen instead of chasing them after they’ve already started.
Your Trading Revolution Starts NOW
The difference between struggling traders & consistently profitable ones isn’t talent, luck, or even starting capital – it’s using the RIGHT tools at the RIGHT time. The advanced indicators we’ve covered in this guide represent decades of market wisdom condensed into practical trading tools. Each one offers unique insights that can transform your understanding of market behavior & dramatically improve your trading results.
Remember, these indicators work best when combined intelligently rather than used in isolation. The Ichimoku Cloud might show you the overall trend direction, while Volume Profile reveals where the big money is positioned, & Fibonacci levels give you precise entry & exit points. When multiple advanced indicators align & point in the same direction, you’ve found what professional traders call a “high-probability setup” – the kind of trade that can skyrocket your profits while minimizing your risk.
But knowledge without ACTION is worthless. Start by adding ONE of these indicators to your current trading setup. Master it completely before moving on to the next one. Practice on demo accounts until you can read these indicators like a professional. The forex market will always be there, but opportunities to gain a significant edge over other traders are rare. You now have access to the same advanced tools that professional traders & hedge funds use to generate consistent profits.
The CHOICE is yours – continue using basic indicators that everyone else uses, or step up to the advanced level where the real money is made. Your trading account will thank you for making the right decision.